Debug Mini Program
Introduction
At this stage Zepp OS development tools do not support breakpoint debugging code, adding logging is the best debugging tool.
This article will cover the following.
- Adding logs in the Mini Program
- Simulator to view logs
- Viewing the real machine logs
Add logs in the Mini Program
The Overall Architecture, you can understand that a complete Zepp OS Mini Program is divided into "Device App", "Settings App" and "Side Service".
They have a slightly different way of adding logs to the code.
For "Device App" it is recommended to use the log function of the @zos/utils module.
And you can print different levels of logs by different methods to facilitate filtering logs.
import { log } from '@zos/utils'

const pageLogger = log.getLogger('page')

pageLogger.log('page created')
pageLogger.error('page error')
For "Settings App" and "Side Service", you can use console.log to print the logs as described in the framework interface.
View Simulator Log
Take the effect of the TodoList Mini Program running on the simulator as an example.
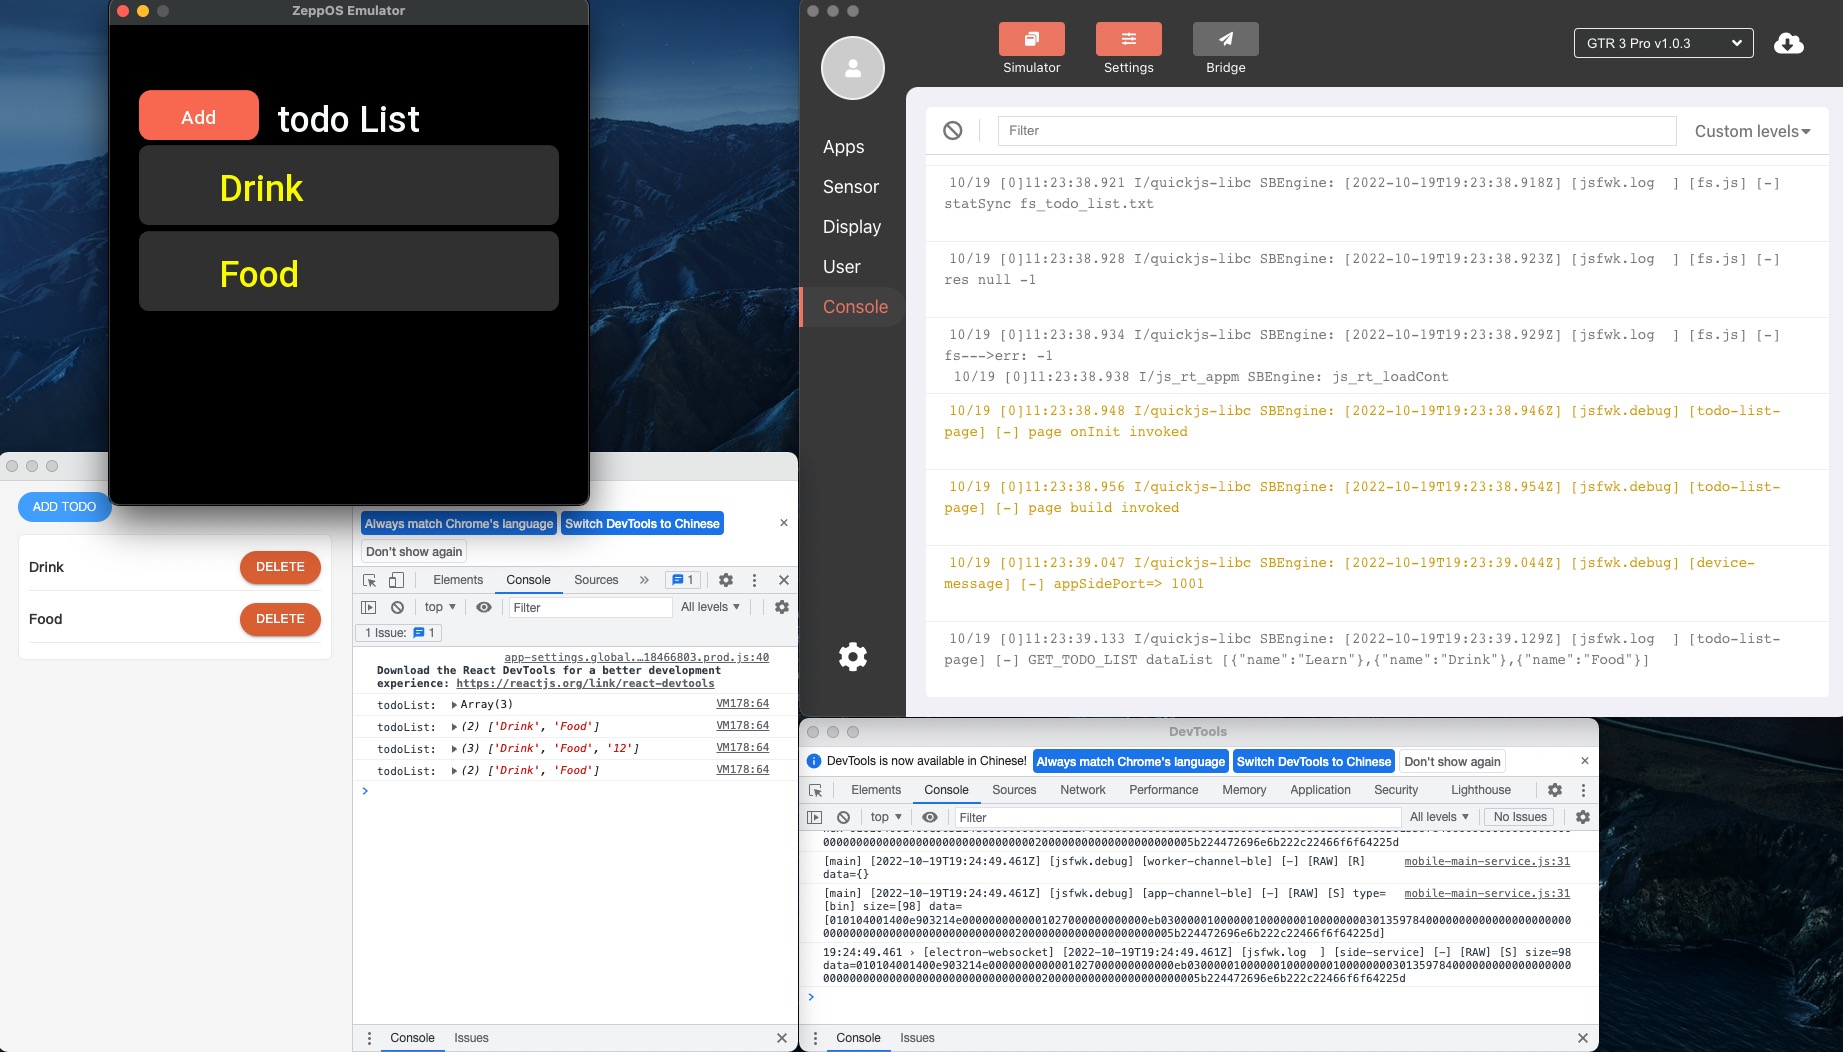
Device App Log
In the main screen of the simulator, click the Console button on the left side to see the "Device App" log.
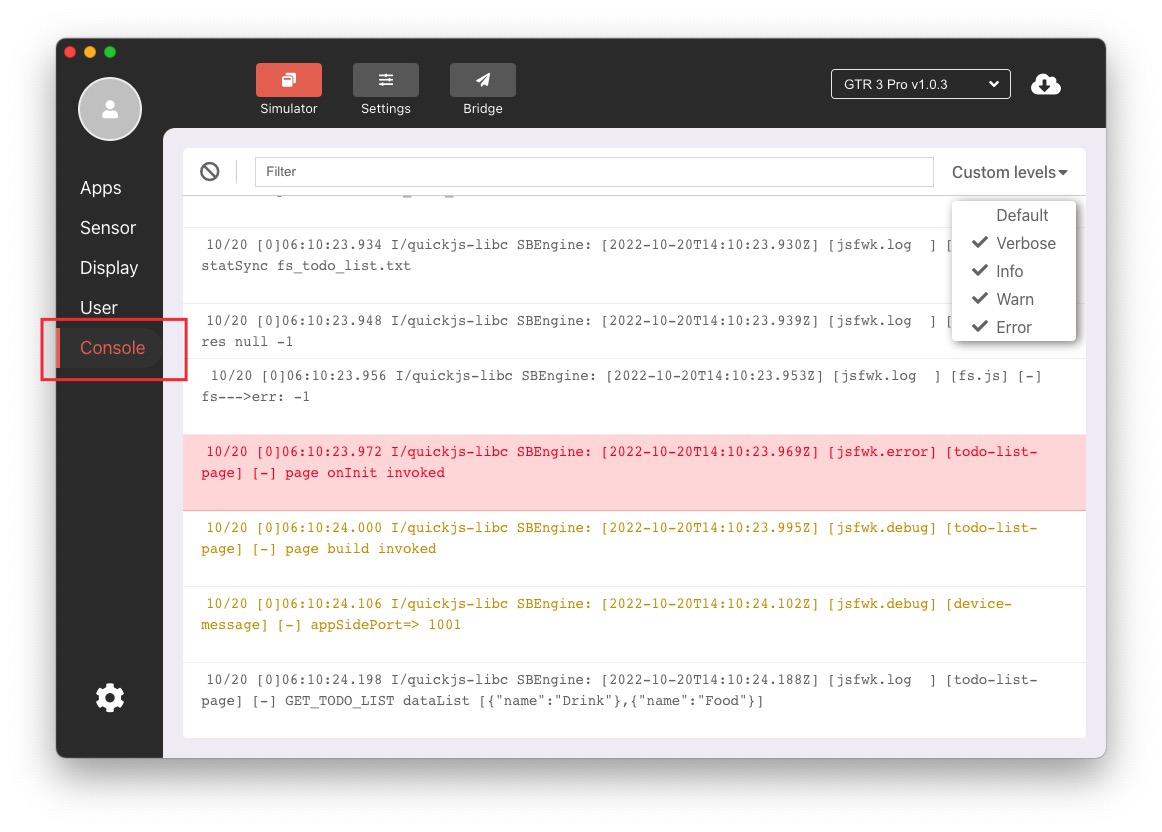
Different levels of logs are displayed with clear color distinction, the upper right corner can be quickly filtered according to the log level, and a string filtering rule function is also provided.
Settings App Log
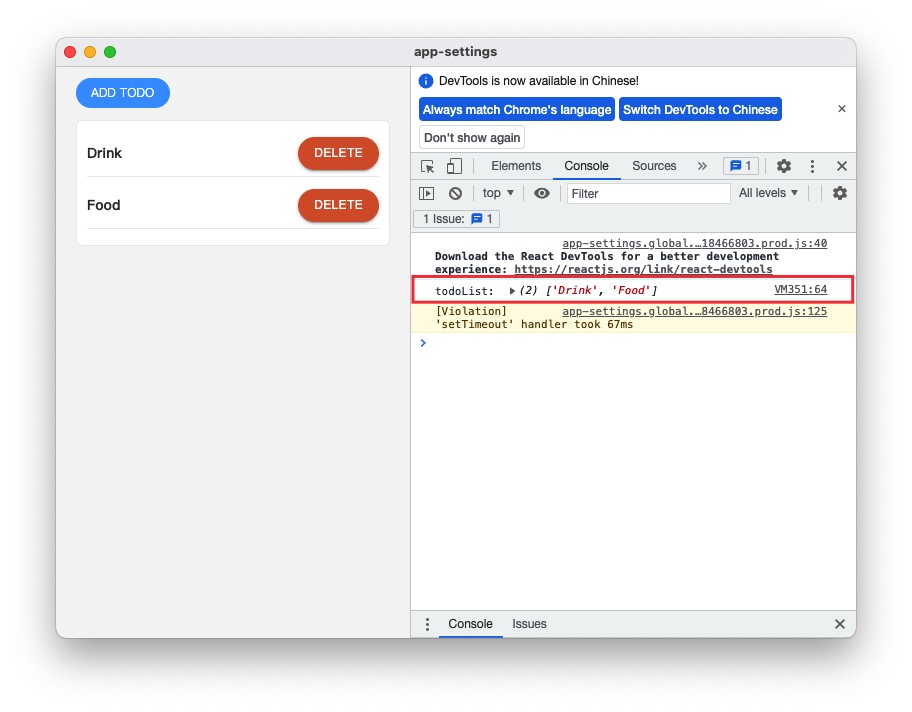
The console next to the "Settings App" simulator makes it easy to see the relevant logs, which also provide filtering capabilities.
Side Service Log
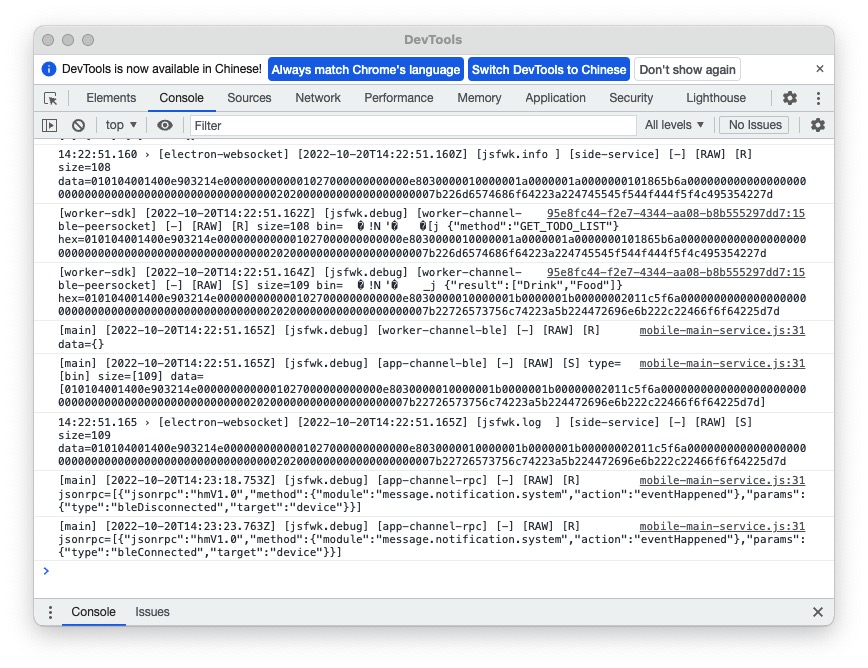
The Side Service log window is launched along with the Device Simulator and also has a log filtering function.
Real Machine Log
The real machine logs need to be viewed using the developer mode of the Zepp App, refer to.