HISTOGRAM
Start from API_LEVEL
2.0. Please refer to API_LEVEL.
Draws a histogram.
Create UI widget
import { createWidget, widget } from '@zos/ui'

const histoGram = createWidget(widget.HISTOGRAM, Param)
Type
Param: object
| Properties | Description | Required | Type |
|---|---|---|---|
| x | The x-coordinate of widget. | YES | number |
| y | The y-coordinate of widget. | YES | number |
| w | The width of widget. | YES | number |
| h | The height of the widget. | YES | number |
| item_width | Width of column. | YES | number |
| item_space | Space of column. | YES | number |
| item_radius | Radius of column. | YES | number |
| item_start_y | The starting Y point of the column, relative coordinate, default is 0 if not filled. | NO | number |
| item_max_height | Maximum height of column.If unfilled,default is widget height. | NO | number |
| item_color | Color of column. | YES | number |
| data_min_value | Minimum value of the column.Used to calculate the actual height of the column. | YES | number |
| data_max_value | Maximum value of the column.Used to calculate the actual height of the column. | YES | number |
| data_array | Data array of columns. | YES | Array<number> |
| data_count | Length of data. | YES | number |
| xline | Configuration objects for the x-axis. | YES | XLine |
| xText | Configuration object for x-axis text. | YES | XText |
| yline | Configuration objects for the y-axis. | YES | YLine |
| yText | Configuration object for y-axis text. | YES | YText |
XLine: object
| Properties | Description | Required | Type |
|---|---|---|---|
| pading | Margin of dividing line based on x-axis. | YES | number |
| space | The interval of the dividing line. | YES | number |
| start | The y-axis coordinates of the start of the divider. | YES | number |
| end | The y-axis coordinate of the end of the divider end-start is the width of the divider. | YES | number |
| width | The width of the line. | YES | number |
| count | The number of dividers. | YES | number |
| color | The color of the dividing line. | YES | number |
YLine: object
| Properties | Description | Required | Type |
|---|---|---|---|
| pading | Margin of dividing line based on y-axis. | YES | number |
| space | The interval of the dividing line. | YES | number |
| start | The x-axis coordinates of the start of the divider. | YES | number |
| end | The x-axis coordinate of the end of the divider end-start is the width of the divider. | YES | number |
| width | The width of the line. | YES | number |
| count | The number of dividers. | YES | number |
| color | The color of the dividing line. | YES | number |
XText: object
| Properties | Description | Required | Type |
|---|---|---|---|
| x | The initial x-coordinate of the text. | YES | number |
| y | The initial y-coordinate of the text. | YES | number |
| w | The width of the text. | YES | number |
| h | The height of the text. | YES | number |
| space | The spacing of the text.The x-coordinate of the nth text = x + (w + space)*(n - 1). | YES | number |
| color | The color of the text | YES | number |
| data_array | The array of text. | YES | Array<string> |
| count | The length of the array. | YES | number |
yText: object
| Properties | Description | Required | Type |
|---|---|---|---|
| x | The initial x-coordinate of the text. | YES | number |
| y | The initial y-coordinate of the text. | YES | number |
| w | The width of the text. | YES | number |
| h | The height of the text. | YES | number |
| space | The spacing of the text.The x-coordinate of the nth text = y + (h + space)*(n - 1). | YES | number |
| color | The color of the text | YES | number |
| data_array | The array of text. | YES | Array<string> |
| count | The length of the array. | YES | number |
Update item data
const view = ......;
  view.setProperty(prop.UPDATE_DATA, {
  data_array: [100, 100, 0, 0, 0, 100],
  data_count: 6
})
Code example
import { createWidget, widget, align } from '@zos/ui'
Page({
build() {
const fillRect = createWidget(widget.FILL_RECT, {
x: 100,
y: 120,
w: 300,
h: 300,
color: 0xffffff
})
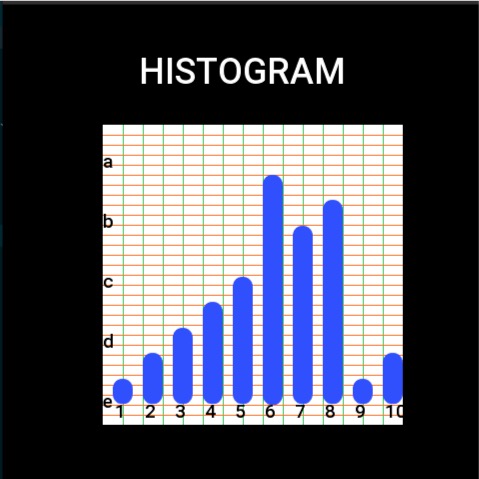
const view = createWidget(widget.HISTOGRAM, {
x: 100,
y: 120,
h: 300,
w: 300,
item_width: 20,
item_space: 10,
item_radius: 10,
item_start_y: 50,
item_max_height: 230,
item_color: 0x304ffe,
data_array: [20, 30, 40, 50, 60, 100, 80, 90, 20, 30],
data_count: 10,
data_min_value: 10,
data_max_value: 100,
xline: {
pading: 20,
space: 20,
start: 0,
end: 300,
color: 0x00c853,
width: 1,
count: 15
},
yline: {
pading: 10,
space: 10,
start: 0,
end: 300,
color: 0xff6d00,
width: 1,
count: 30
},
xText: {
x: 12,
y: 270,
w: 20,
h: 50,
space: 10,
align: align.LEFT,
color: 0x000000,
count: 10,
data_array: ['1', '2', '3', '4', '5', '6', '7', '8', '9', '10']
},
yText: {
x: 0,
y: 20,
w: 50,
h: 50,
space: 10,
align: align.LEFT,
color: 0x000000,
count: 6,
data_array: ['a', 'b', 'c', 'd', 'e', 'f']
}
})
}
})